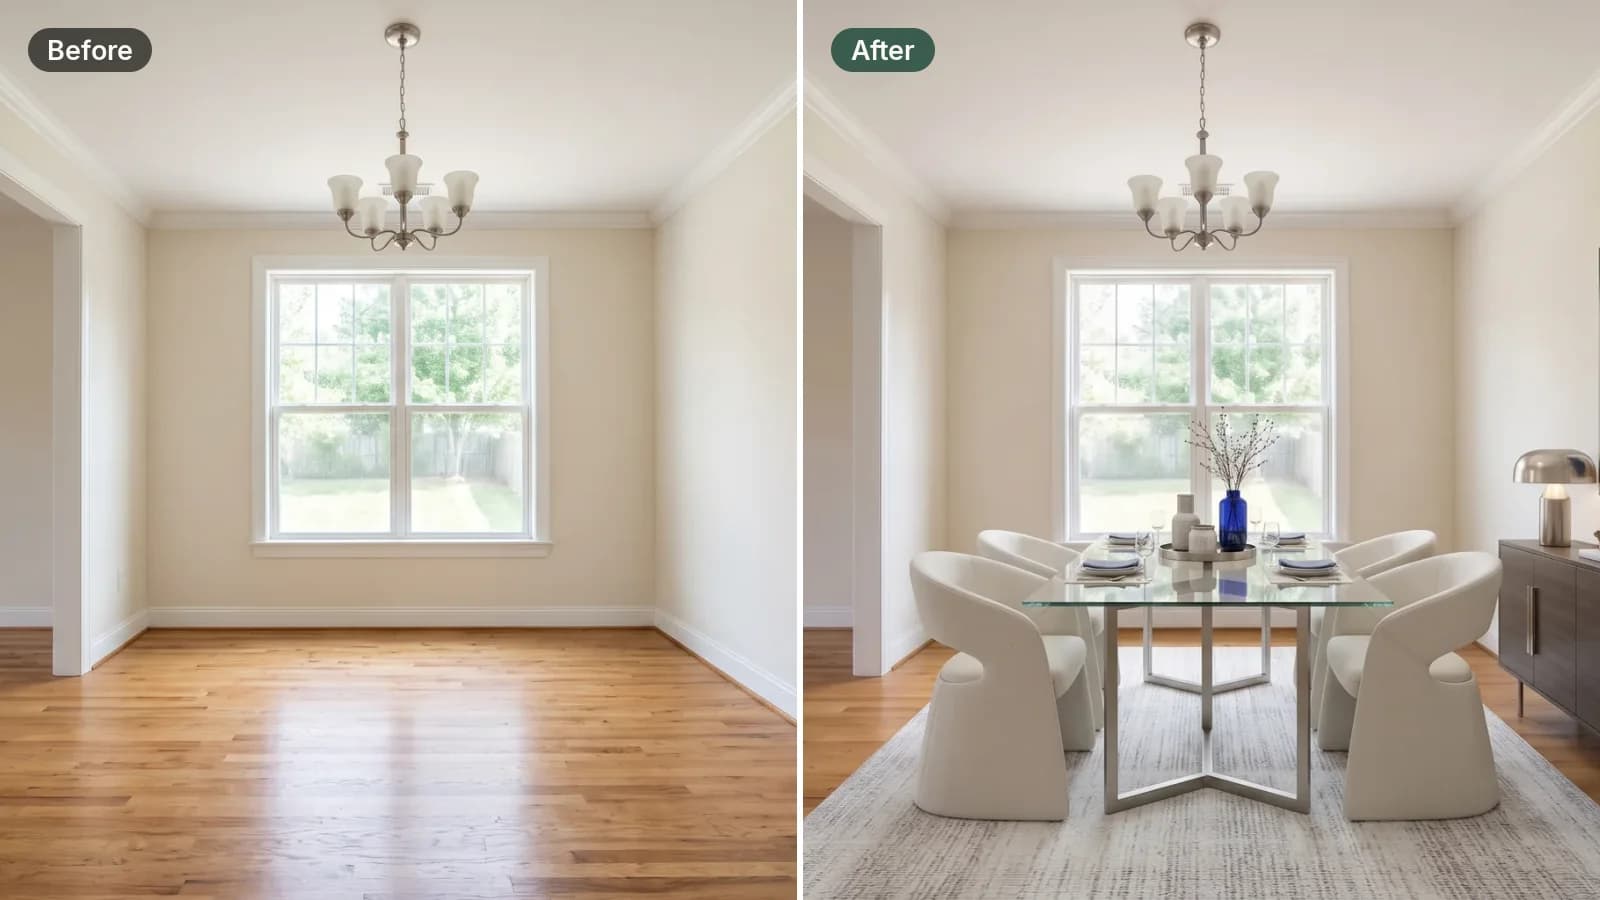
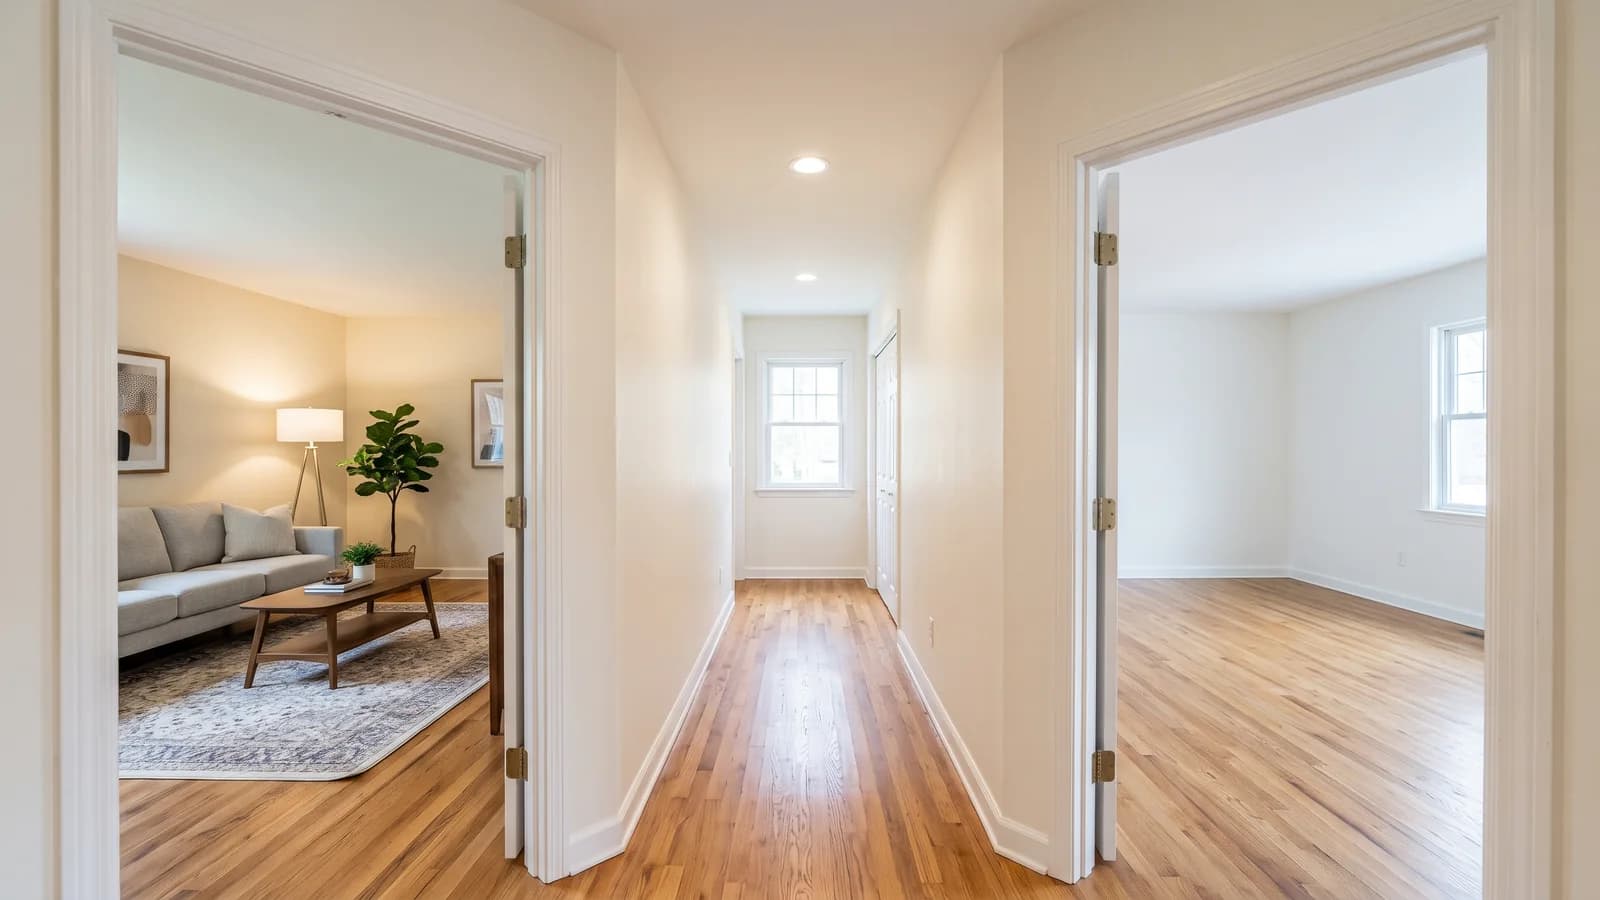
Guide · 6 min read
Virtual Staging Statistics: The 2026 Data
What agents report about sale speed and price, how buyers use listing photos and what staging costs. Every number names its source.
· By the StageHQ team
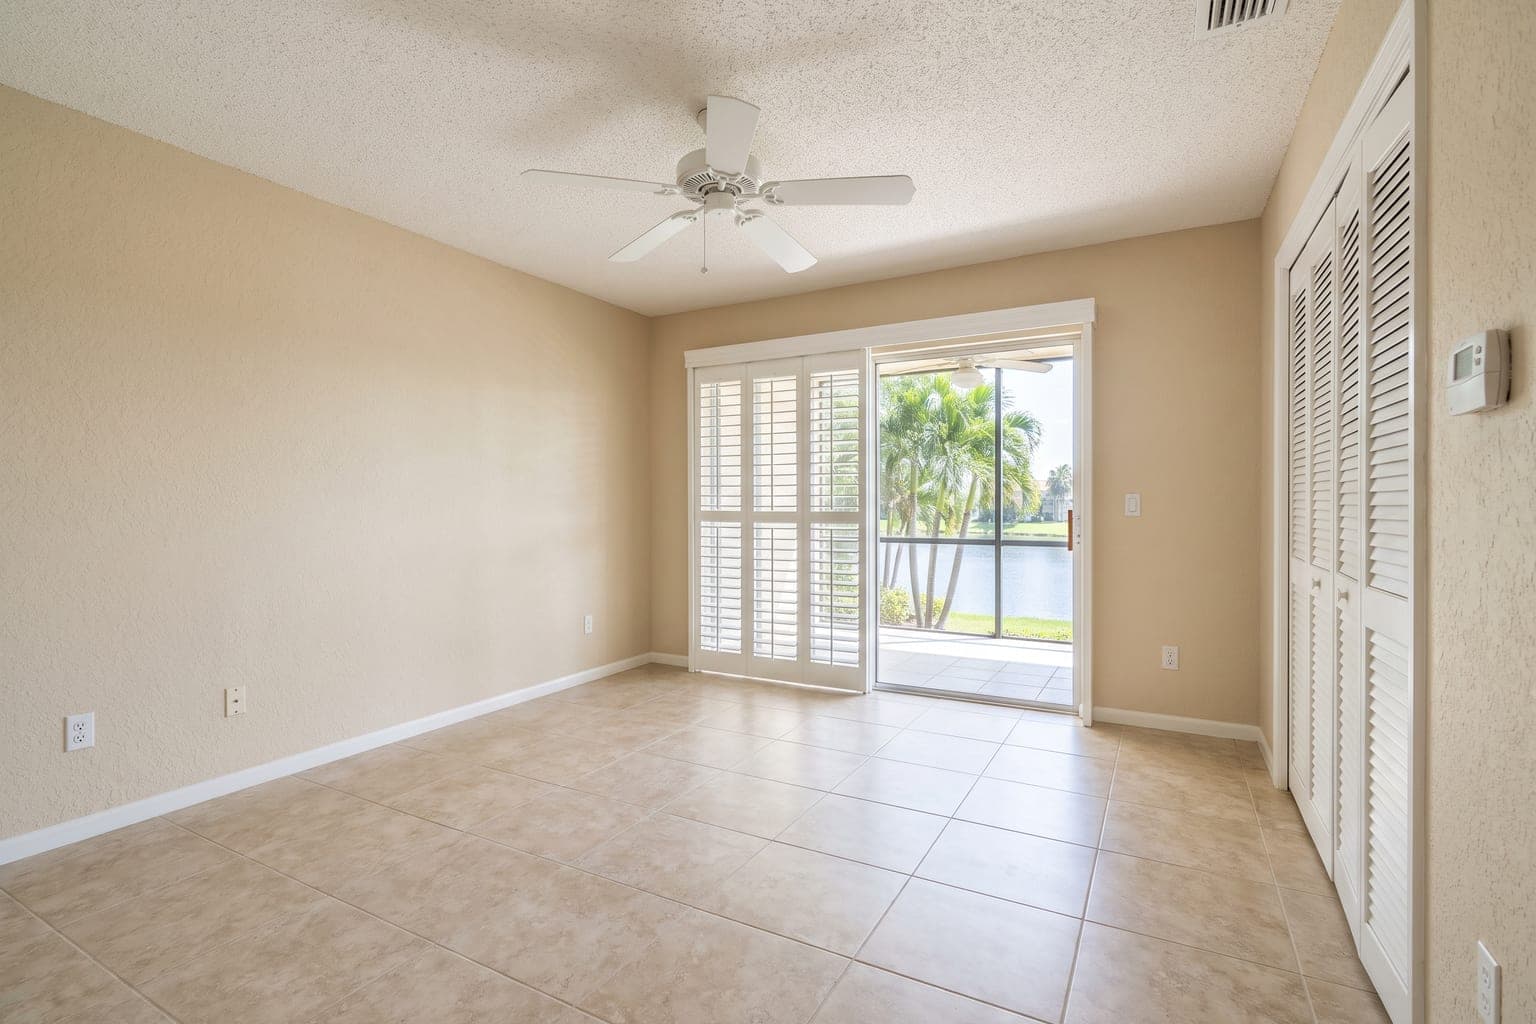 Before
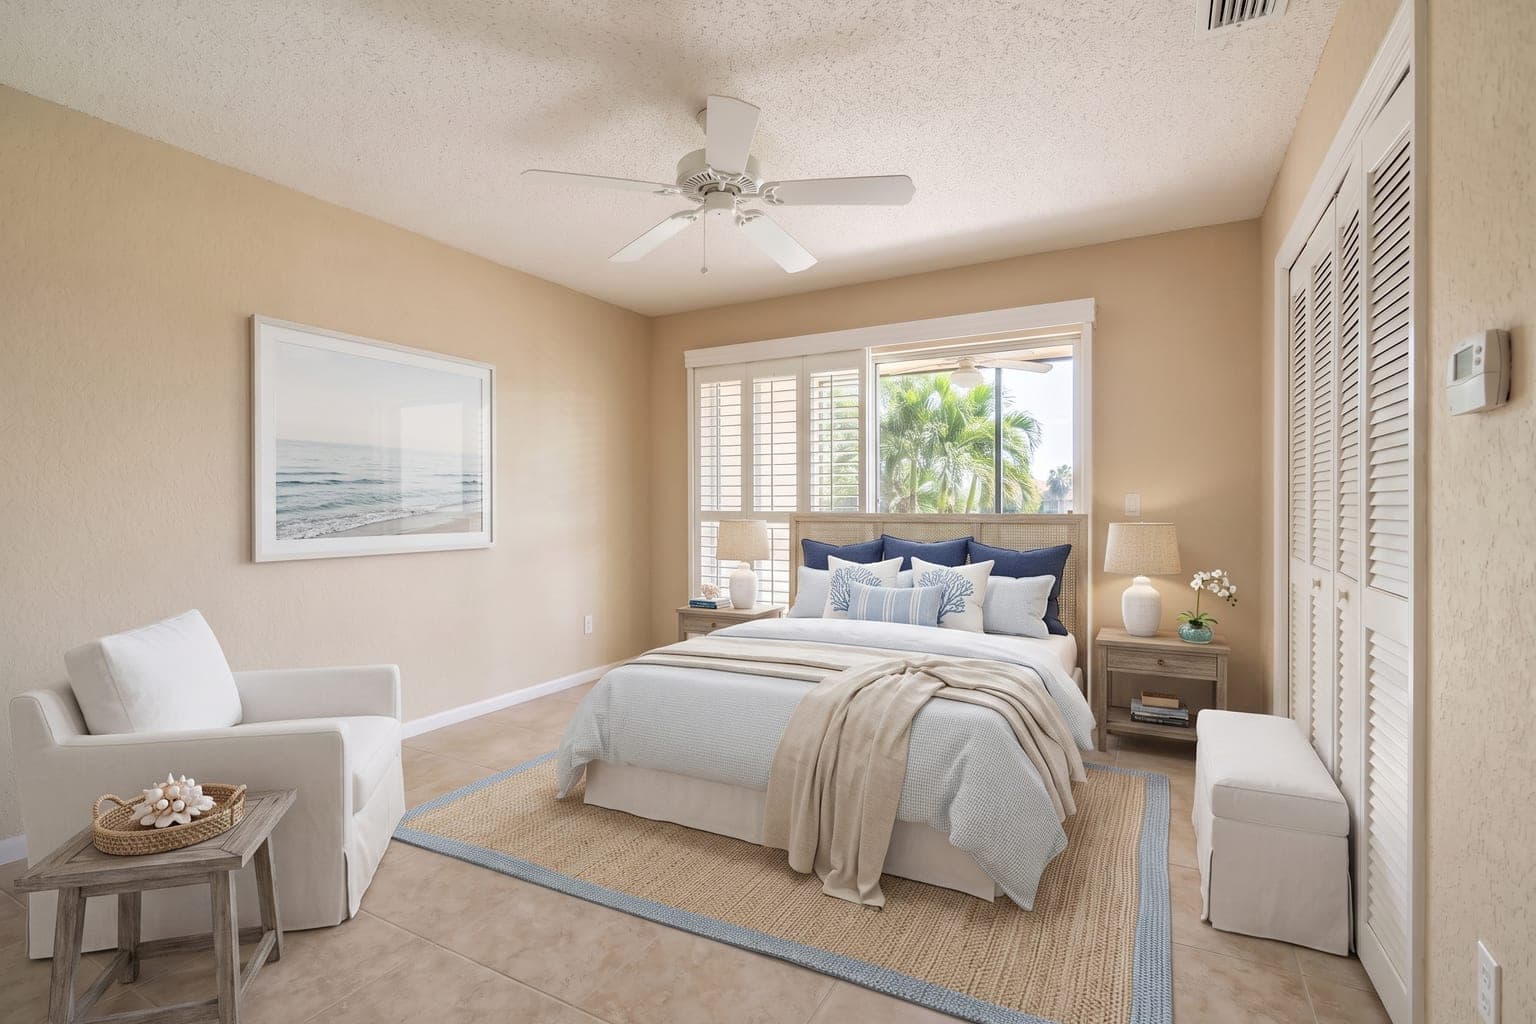 After
Staging works — but "works" deserves numbers. This page collects statistics on home staging and virtual staging from named sources. Every figure names its source and year, and where the evidence is thin, the page says so.
The headline numbers
- of buyers' agents: easier to picture the home (NAR 2025)
- 83%
- of sellers' agents: shorter time on market (NAR 2025)
- 49%
- median cost of a staging service (NAR 2025)
- $1,500
- of online searchers: photos very useful (NAR 2026)
- 81%
Staging and sale outcomes
The best public source is the 2025 Profile of Home Staging from the National Association of Realtors (NAR), an online survey of 1,266 agents in February 2025. The figures are what agents report, not sale records.
- 83% of buyers' agents said staging made it easier for a buyer to visualize the property as a future home.
- 49% of sellers' agents said staging shortened time on market: 19% greatly and 30% slightly. Another 17% saw no effect and 21% did not know.
- 29% of sellers' agents said staging raised the offer by 1% to 10%. But 30% saw no effect on price and 34% were not sure.
A higher sale price is not proven. The often-quoted "staged homes sell 73% faster" comes from a 2011 trade guide about homes that were staged after they had failed to sell, not from a comparison with unstaged homes, so this page no longer quotes it as a result. Does staging help sell a house? reviews each study with its sample and its caveat.
Buyer behavior online
- 81% of buyers who searched online rated photos very useful, more than any other website feature (NAR, 2026 Home Buyers and Sellers Generational Trends, 6,103 recent buyers).
- 31% of buyers' agents said buyers were more willing to walk through a staged home they had seen online (NAR, 2025).
- The lead photo carries the listing: in a portal feed, a buyer decides in seconds whether to open it at all.
The cost gap, quantified
| Method | Typical cost | Turnaround |
|---|---|---|
| Physical staging | $1,500 median for a staging service (NAR, 2025) | 1–2 weeks |
| Human-edited virtual staging | $24–$39 per image | 24–48 hours |
| AI virtual staging (StageHQ) | $0.28–$0.95 per image | About a minute |
The arithmetic for a full 8-photo listing: roughly $2–$8 with AI staging, $150–$350 with human-edited services, and a median of $1,500 with a staging service, more for a vacant home. Provider prices are in how much virtual staging costs; the full range for physical staging is in what home staging costs.
Which rooms get staged
- Buyers' agents rated the living room the most important room to stage (37% said very important), then the primary bedroom (34%) and the kitchen (23%) (NAR, 2025).
- Sellers' agents staged the living room most often (91%), then the primary bedroom (83%) and the dining room (69%) (NAR, 2025).
- Most listings are staged in part: a few key rooms, not the whole house. Partial home staging ranks the rooms and prices each option.
Add your listings to the dataset
Stage your first 3 photos free and judge the result on your own listing.